A segmented bar chart, also called a stacked bar chart or divided bar chart, is a bar graph where each bar is split into colored segments that represent sub-categories. Each segment's length is proportional to its share of the total, making it easy to see both the overall value and how it breaks down at the same time.
If you have ever looked at a bar chart and thought, "Okay, but what's inside each bar?" that's exactly the question a segmented bar graph was built to answer.
It's one of those chart types that looks fancy at first but is actually pretty straightforward once you know what you're looking at. Whether you ran into one in your AP Statistics class, a business report, or a news article, this guide covers everything: what it is, when to use it, how to read it, and how to make one without needing any software installed on your computer.
Let's get into it.
What Is a Segmented Bar Chart?
A segmented bar chart is a type of bar graph where each bar is divided into stacked sections, with each section representing a sub-category of the main category on the axis.
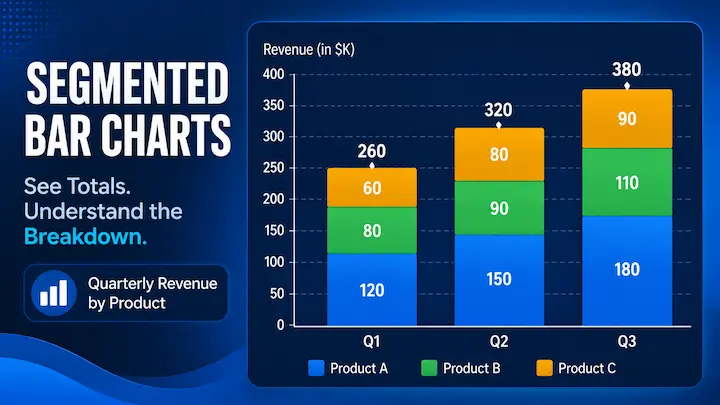
Instead of showing just one value per bar, it shows a breakdown. So if you have a bar representing "Q1 Revenue," the segments inside it might show how much came from Product A, Product B, and Product C. You get the total from the full bar height, and the breakdown from the individual segments.
All the segments in one bar add up to the total for that category. That's what makes it a "stacked" chart — you're literally stacking the sub-categories on top of each other.
The colors matter a lot here. Each sub-category gets its own color, and a legend tells you which color maps to which group. Without the legend, the chart is just a pile of colored rectangles.
Segmented Bar Chart vs Regular Bar Chart — What Changes?
A regular bar chart shows one value per bar. That's it. Simple, clean, effective for direct comparisons.
A segmented bar chart shows one bar per category, but that bar is made up of multiple segments — one for each sub-category. So you're seeing more information, but packed into the same visual space.
Here's a quick comparison:
| Feature | Regular Bar Chart | Segmented Bar Chart |
|---|---|---|
| Values per bar | 1 | Multiple (stacked segments) |
| Shows sub-group breakdown | No | Yes |
| Shows total per category | Yes | Yes |
| Best for | Simple comparisons | Part-to-whole + comparison |
| Visual complexity | Low | Medium |
The trade-off is readability. A regular bar chart is easier to read at a glance. A segmented bar chart carries more information, but it takes slightly more effort to interpret, especially when comparing segments that don't start at the same baseline (more on that below).
Types of Segmented Bar Charts
There are two main versions, and they serve slightly different purposes.
Standard Stacked Bar Chart
This is the classic version. Each bar shows the actual values of the sub-categories stacked on top of each other. The full bar height represents the total for that category.
Use this when the totals matter. If you want to compare how total revenue changed quarter over quarter while also showing the product mix, the standard stacked chart does that well.
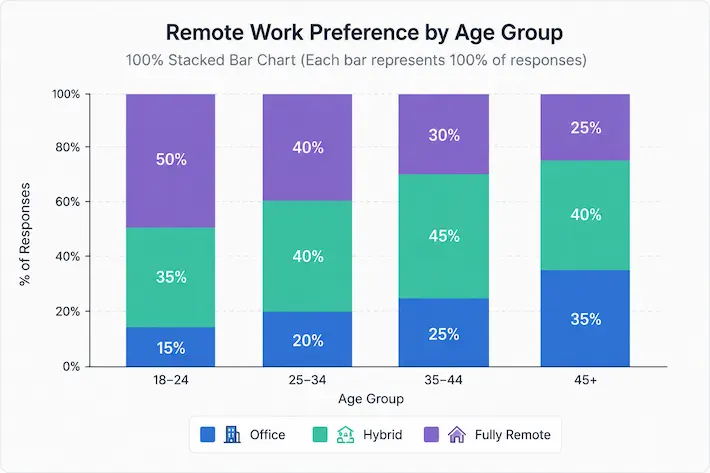
100% Stacked Bar Chart (Normalized)
In this version, every bar is stretched to the same height of 100%. The segments show each sub-category as a percentage of the total, not the raw value.
This is useful when the totals aren't relevant, but the proportions are. For example, if you're comparing survey responses across five different age groups and each group has a different number of respondents, the 100% stacked version lets you compare distributions fairly regardless of group size.
It's sometimes called a normalized bar chart or a relative frequency bar chart, especially in statistical contexts.
When to Use a Segmented Bar Chart
Segmented bar charts shine in specific situations. They're not a default choice; they're a deliberate one.
Use a segmented bar chart when:
- You want to show totals AND how they break down at the same time
- You have a reasonable number of sub-categories (ideally 3–5; more than 6 gets messy)
- You're comparing the composition of different groups or time periods
- The categories are mutually exclusive (each data point belongs to only one sub-group)
- You want to show how the mix inside something changes over time
Some real-world examples where this chart type works well:
- Survey results broken down by age group ("How did different age groups answer this question?")
- Monthly website traffic by source (organic, direct, referral, social) over 12 months
- Sales revenue by region, tracked quarterly
- Population breakdown by education level across multiple countries
- Budget allocation by department, shown year over year
When NOT to Use a Segmented Bar Chart
This chart has a known weakness: comparing the inner segments is hard.
Only the bottom segment (the one sitting on the baseline) can be compared accurately across bars. Every other segment floats at a different height because it starts where the previous one ended. Your eye can't reliably judge sizes that aren't anchored to a common baseline.
If your goal is to compare sub-group values directly across categories, a grouped bar chart (side-by-side bars) is a better fit. It trades the "total view" for better subgroup comparability.
Also, don't use a segmented bar chart when:
- You have more than 5–6 sub-categories (the segments become unreadably thin)
- Exact values matter more than proportions (data labels help, but only to a point)
- You're showing continuous data over time (a line chart is more appropriate there)
If you're not sure which chart type fits your data, the bar chart types guide walks through all the main options with examples.
How to Read a Segmented Bar Chart
Reading a segmented bar graph is mostly intuitive, but there are a few things to pay attention to.
Start with the legend. Before you look at the bars, figure out which color represents which sub-category. This context shapes everything else you'll read.
Look at the total bar height first. The full height of each bar tells you the total for that category. Use this to compare totals across categories.
Then look at individual segments. The bottom segment is the easiest to compare across bars because it starts at zero for all bars. The segments above it start at different heights, so comparing them is trickier. Use data labels (the numbers printed inside or on top of each segment) if they're available.
In a 100% stacked chart, ignore bar height (they're all the same) and focus only on segment width or proportion. This version is purely about relative composition, not absolute values.
One useful habit: if you want to compare a specific sub-group across all bars, trace that color segment across the whole chart horizontally. It's easier than jumping up and down through the stack.
Segmented Bar Chart Examples
Let's look at a few realistic scenarios to make this concrete.
Example 1: Survey Results by Age Group
Imagine a survey asking 500 people about their preferred remote work setup: "Office," "Hybrid," or "Fully Remote." You survey four age groups: 18–24, 25–34, 35–44, and 45+.
A segmented bar graph would put the four age groups on the x-axis. Each bar would have three segments — one per answer. You could instantly see not just which answer was most popular overall, but how the preference pattern shifts across age brackets. Younger respondents might skew heavily toward "Fully Remote," while older respondents split more evenly.
Example 2: Monthly Traffic by Source
A website sees traffic from five sources: Organic, Direct, Email, Referral, and Social. Plotting this over 12 months with a segmented bar chart gives you a month-by-month view of total traffic alongside the channel mix. If organic starts shrinking as a proportion while direct grows, the stacked chart makes that shift obvious.
Example 3: Sales Revenue by Region
A company operating in North America, Europe, and Asia tracks quarterly revenue. Each bar represents one quarter, and the segments show how much each region contributed. You can see both how total revenue trended and whether regional contributions shifted over time.
These are the kinds of multi-layered stories a segmented bar chart tells well and that a simple bar chart can't.
Segmented Bar Chart in AP Statistics
If you're a student who ended up here because of an AP Stats assignment, you're in the right place.
In AP Statistics, segmented bar graphs are a standard tool for displaying the conditional distribution of a categorical variable. They come up frequently in two-way table problems, where you have two categorical variables and want to visualize how one is distributed across the other.
The 100% stacked version (normalized segmented bar chart) is especially common in AP Stats because it shows relative frequencies, not raw counts. When comparing groups of different sizes, relative frequency is the fair comparison.
A few terms you'll see in this context:
- Relative frequency: The proportion of each sub-category, usually expressed as a percentage
- Conditional distribution: The distribution of one variable given a specific value of another variable
- Two-way table: The data source — rows and columns showing counts for two categorical variables
If your data is in a two-way frequency table, a segmented bar chart is almost certainly the visualization your instructor is looking for.
According to the College Board's AP Statistics curriculum, students should be able to construct and interpret segmented bar graphs as part of exploring categorical data, so nailing this chart type is worth your time.
How to Make a Segmented Bar Chart Online
You don't need Excel. You don't need Python. You can make one right in your browser, for free, in about two minutes.
Here's how to do it with DataViz Kit's free Bar Graph Maker:
Step 1: Open the Bar Graph Maker. Head to our tool — no account needed, no download, nothing to install.
Step 2: Enter your data. Paste or type your data into the table. Each column represents a sub-category (segment), and each row represents a main category (bar). For example:
| Category | Product A | Product B | Product C |
|---|---|---|---|
| Q1 | 40 | 30 | 20 |
| Q2 | 35 | 40 | 25 |
| Q3 | 50 | 25 | 30 |
Step 3: Switch to Stacked mode. Look for the "Stacked" layout toggle in the chart controls. Click it, and your grouped bars instantly become a segmented stacked chart. No reformatting, no extra steps.
Step 4: Customize Change colors to match your brand or preferences, add a title, toggle data labels on or off, and adjust the legend position. The tool handles the rest automatically.
Step 5: Export Download your segmented bar chart as a PNG or SVG file. SVG is great if you need to resize without losing quality. All processing happens in your browser as DataViz Kit is fully client-side, so your data never gets uploaded to any server.
That's the whole process. Under two minutes, free, no strings.
How to Make a Segmented Bar Graph in Excel
If you do want to use Excel, here's the short version:
- Set up your data with categories in the first column and sub-categories as additional columns
- Select all your data
- Go to Insert → Charts → Bar Chart (or Column Chart)
- Choose Stacked Bar (horizontal) or Stacked Column (vertical)
- Format your segments with the colors and labels you need
Excel calls the vertical version a "Stacked Column Chart" and the horizontal one a "Stacked Bar Chart." They're the same concept with just different orientations. The naming can be a bit confusing, but once you're in the chart type menu, it's visually obvious which is which.
One heads-up: Excel doesn't support SVG export without third-party workarounds. If you need a clean vector export, an online tool like the DataViz Kit Bar Graph Maker is faster and more flexible.
Segmented Bar Chart vs Grouped Bar Chart: Which One to Pick?
This is one of the most common decisions you'll face when working with multi-series bar data. Here's a straightforward way to think about it:
Choose a segmented bar chart if:
- You want to show totals alongside sub-group breakdowns
- Proportions and composition matter more than precise subgroup comparisons
- You have 3–5 sub-categories
Choose a grouped bar chart if:
- Comparing specific sub-group values across categories is your main goal
- Exact differences between sub-groups matter
- You don't need to emphasize totals
The two charts use the same data but answer different questions. A segmented chart asks, "How does the whole break down?" A grouped bar chart asks, "How do the parts compare side by side?"
Neither is universally better. It depends entirely on what you're trying to show.
And if neither feels quite right — if your categories are long-named or you have many of them — a horizontal bar chart version of the stacked chart might also be worth considering. Flipping the orientation gives each category label more room to breathe.
Common Mistakes to Avoid
A few things that make segmented bar charts harder to read than they need to be:
Too many sub-categories. If you have 8 different segments in a single bar, no one can parse that. Combine smaller categories into an "Other" bucket or reconsider whether this chart type is right.
No data labels. Without numbers, readers can only estimate segment sizes. Add data labels where space allows, especially for segments that don't start at zero.
Bad color choices. Using colors that are too similar makes segments hard to distinguish. Avoid red/green combinations for accessibility reasons (colorblind readers will struggle). DataViz Kit's built-in color presets handle this for you.
Using a stacked chart when you should use 100% stacked. If your groups have very different total sizes, the standard stacked chart will visually mislead — larger groups will just look bigger overall. Switch to 100% stacked when proportions are what you're communicating.
For a broader look at chart mistakes that sneak into everyday data work, the bad data visualization guide is worth a read.
Conclusion
Segmented bar charts are one of the more versatile chart types out there. They do something that most charts can't: show you the total and the breakdown in the same view. That's genuinely useful — whether you're analyzing survey data for a school project, presenting quarterly revenue to a team, or just trying to make sense of a dataset with multiple sub-groups.
The key things to remember: use it when proportions and totals both matter, keep your sub-categories to five or fewer, and pick the 100% stacked version when group sizes differ significantly.
And if you're ready to build one right now, DataViz Kit's free Bar Graph Maker has a stacked mode built in — no Excel, no downloads, no data uploaded anywhere. Just open it, paste your numbers, and export.