Pull up any spreadsheet, hit insert chart, and you'll probably spot a histogram and a bar graph sitting right next to each other in the menu. They even look like cousins, same rectangles, same general vibe. That's exactly why so many people treat histogram and bar graph as interchangeable words. They aren't. This histogram vs bar graph mix-up shows up everywhere, in classrooms, in client meetings, and even in textbooks that really should know better by now.
Here's the good news though. Once someone walks you through it without the usual statistics jargon, the actual difference is pretty simple. A histogram is built for numbers that flow into ranges, like ages or test scores. A bar graph is built for comparing separate groups, like sales by region or votes by candidate. That's the whole story in a nutshell, but the small details still matter if you want your charts to say exactly what you mean.
Stick around and you'll be able to glance at either chart and know instantly what you're looking at. There are also a couple of free tools waiting at the end that'll build either one for you in about ten seconds flat.
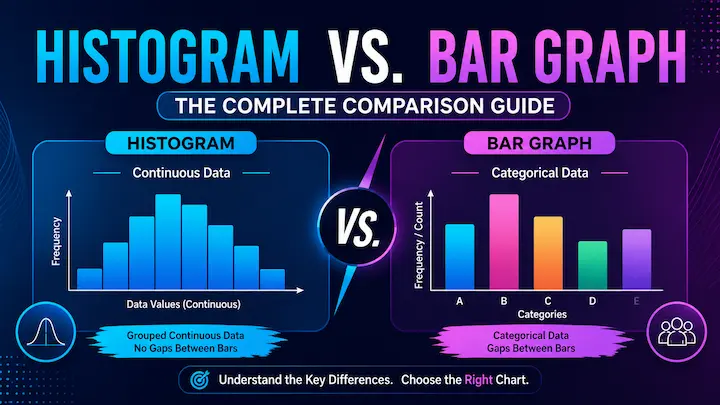
If you only remember one thing from this whole guide, remember this: a histogram has no gaps between its bars because it's tracking a continuous range of numbers, while a bar graph almost always has gaps because it's comparing things that don't blend into each other. Everything else below just builds on that one idea.
Maybe you've even sat in a meeting where someone confidently called a bar graph a histogram, and nobody said a word because, honestly, who wants to be that person.
What Exactly Is a Histogram?
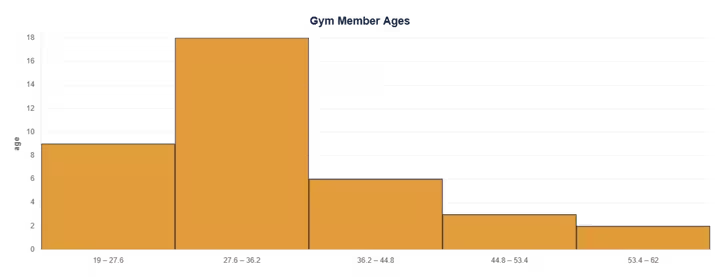
A histogram takes a pile of numbers and groups them into ranges called bins. Picture a teacher with thirty exam scores. Instead of listing every single score one by one, she sorts them into chunks: 60 to 69, 70 to 79, 80 to 89, and so on. Each bar in the histogram shows how many scores landed in that chunk.
Because the data is continuous, meaning it can land anywhere along a scale rather than fitting into a fixed label, the bars sit shoulder to shoulder with zero space between them. That's not a design choice. It's the entire point. The lack of gaps tells you the data flows smoothly from one range into the next, without any real break.
If you want to see this in action without doing the math by hand, you can drop your own numbers into our histogram maker and watch it sort everything into bins and draw the chart automatically. It's oddly satisfying watching a messy column of numbers turn into a clean shape in a couple of clicks.
For the deeper statistical version of this, NIST's Engineering Statistics Handbook covers histograms as one of the core tools for exploring how data is distributed. Fair warning though, it reads a fair bit drier than this guide.
And What About a Bar Graph (or Bar Chart)?
A bar graph works completely differently. Instead of ranges of numbers, it compares separate categories that don't naturally flow into one another. Favorite pizza toppings, sales by region, votes per candidate, that kind of thing.
Picture a survey asking a hundred people their favorite ice cream flavor. Chocolate gets one bar, vanilla gets another, strawberry gets a third. Nothing forces chocolate to sit next to vanilla on some shared number line, because there is no number line connecting them at all. They're just separate buckets sitting next to each other.
That's exactly why bar graphs usually have gaps between the bars. The space is doing real work. It's a visual reminder that each bar stands on its own, rather than being a slice of one continuous range. You can also reorder the bars however you like, alphabetically, by size, by whatever makes sense for the story you're telling, and the data itself doesn't change one bit. Try that with a histogram, and the whole chart stops making sense.
Khan Academy has a solid breakdown of categorical data and bar graphs if you'd like a second source on this. Their examples are some of the clearer free ones floating around online.
If you'd rather skip the manual setup, our bar graph maker lets you paste in your categories and values and outputs a clean chart in seconds.
Quick note before moving on: bar graph and bar chart are just two names for the exact same thing. Nobody's hiding a third chart type from you.
Spotting the Differences at a Glance
Here's where it gets genuinely useful. Once the two charts sit side by side, the differences are easy to spot, even from across a room.
| Histogram | Bar Graph | |
|---|---|---|
| Data type | Continuous numbers (ages, scores, heights) | Separate categories (flavors, regions, names) |
| Gaps between bars | None | Yes, usually |
| X-axis shows | Ranges of values (bins) | Distinct labels |
| Bar order | Fixed, follows the number line | Can be rearranged freely |
| Typical question it answers | How spread out is this data? | How do these groups compare? |
Most of the confusion melts away once you remember just one row from that table: the gaps. No gaps almost always means a histogram. Gaps almost always mean a bar graph. It's a small detail that does a lot of heavy lifting.
What About "Bar Diagram"? Is That a Third Thing?
Short answer, no. Bar diagram is just an older or more regional way of saying bar graph or bar chart. The phrase shows up a lot in British-style textbooks and in school curriculums across South Asia, where statistics lessons still lean on "bar diagram" as the standard term.
So if a worksheet asks for a bar diagram, it wants the same chart described above. Separate categories, bars with gaps, and zero numbers flowing between them. Don't let the unfamiliar name throw you off.
So Which One Should You Actually Use?
Ask yourself one question before picking a chart: Is the data a measurable range, or is it a set of separate labels?
If you're working with ages, prices, temperatures, test scores, or anything that could technically land anywhere on a number line, reach for a histogram. It shows the shape of that spread instantly, whether the data bunches up in the middle, leans heavily to one side, or scatters all over the place.
If you're comparing distinct groups instead, like departments, products, countries, or survey answers, a bar graph is the better fit. It makes side-by-side comparisons easy to read at a glance, which a histogram was never really built to do.
A quick way to test yourself: "customer ages" calls for a histogram, "customer favorite color" calls for a bar graph. Same dataset, completely different chart, simply because the underlying data behaves in two completely different ways. Once that question becomes second nature, picking the right chart stops feeling like guesswork.
Mistakes People Make Without Even Realizing It
A handful of small slip-ups come up again and again, even among people who technically already know the difference between the two charts.
The biggest one is picking bin sizes carelessly on a histogram. Too few bins and everything gets squashed into two or three giant blocks that hide whatever pattern was actually there. Too many bins and the chart turns jagged and noisy, making a perfectly smooth pattern look choppy for no good reason. There's no single perfect bin count for every dataset, but a decent rule of thumb is to start somewhere around 10 to 20 bins and adjust from there until the shape looks honest rather than dramatic.
Another common one is treating the gap in a bar graph like a style preference instead of a meaningful signal. Removing the gaps doesn't make a bar graph look sleeker or more modern. It just makes it look like a histogram, which sends the wrong message about what kind of data is actually being shown.
And one more sneaky habit worth watching for: reordering the bars in a histogram. It's tempting to drag bars around to make the chart look tidier, especially if one bar seems randomly tall. But histogram bars follow the number line for a reason, and moving them breaks the whole point of the chart.
A Couple of Examples, Side by Side
Sometimes the easiest way to lock all of this in is to look at two real examples sitting right next to each other.
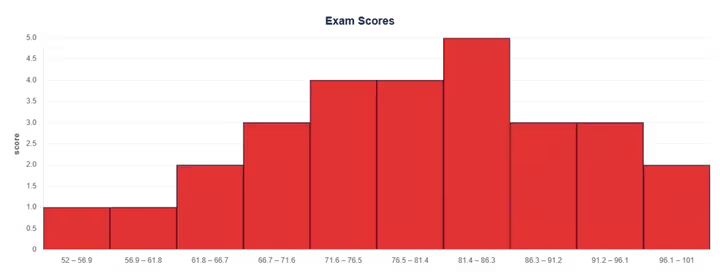
Example one. A gym tracks the ages of two hundred new members this year. That's continuous data, so it becomes a histogram. The shape might show a big cluster somewhere in the 25 to 35 range, tapering off gently on both sides as the ages spread further out.
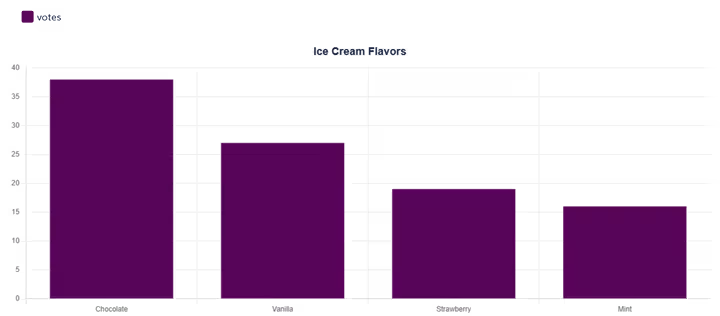
Example two. The same gym also tracks which class type members signed up for the most: yoga, spin, weights, or boxing. That's categorical data, so it becomes a bar graph, one bar per class, with a clear gap between each one.
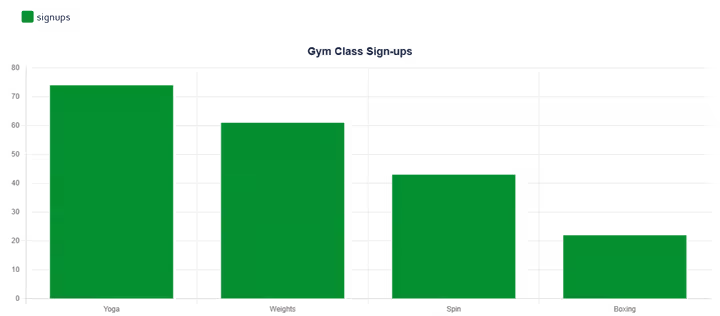
Same gym, same month, two completely different charts. The age question and the class question simply aren't the same kind of question, so they were never going to share the same kind of chart.
The Bottom Line
At the end of the day, the histogram vs bar graph question isn't really a debate once you know what to look for. Check the gaps. Check whether the data is a flowing range or a set of separate groups. That combination is almost always enough to tell you exactly which chart you're looking at.
Getting this right matters more than it might seem at first glance. A misused chart doesn't just look slightly off; it can quietly mislead whoever's reading it, whether that's a classroom full of students, a client reviewing a report, or even your own future self trying to remember what a chart meant six months down the line.
If you'd rather skip the manual chart-building altogether, the free set of chart tools over at DataVizKit covers histograms, bar graphs, and a handful of other formats, so you can paste in your numbers and let the right shape show up on its own. No fighting with spreadsheet formatting, no guesswork, just a chart that says exactly what your data is trying to say.